Learning how to create a sales forecast helps you plan hiring, stock, marketing spend and cash with far more confidence than a gut feeling. You do not need complex software or a finance degree: a simple, honest forecast built from your own data is enough for most small businesses. In this guide you will learn what a sales forecast is, why it matters, five forecasting methods, a 7-step process, a worked example, common mistakes, how to measure accuracy and a template you can copy.
✔ Key takeaways
⏱ About 8 min read · the short version is right here
- A sales forecast estimates how much you will sell over a set period, usually month by month for the next 12 months.
- Pick a method that fits your data: past sales, sales pipeline, lead-driven or market-based forecasting.
- Build the forecast from units and prices per product line, then add recurring revenue from existing customers.
- Always prepare a best case and a worst case, and write down the assumptions behind each number.
- Compare forecast with actual sales every month and adjust; accuracy improves quickly with practice.
📋 In this guide
What is a sales forecast?
A sales forecast is an estimate of the revenue your business expects to earn over a future period. Most small businesses forecast monthly for the next 12 months, then update it every month as real results come in.
A good forecast is not a target or a wish. Targets say what you want to sell; a forecast says what you realistically expect to sell based on evidence. Keeping the two separate stops you from hiring or spending against numbers that were never likely.
📌 Forecast vs budget
The sales forecast feeds your budget and cash flow plan. Expenses, hiring and stock decisions all depend on it, so start here before you plan spending.
Why small businesses need one
Cash
Avoid cash surprises
Knowing quiet months in advance lets you build a buffer. Pair your forecast with a plan to improve cash flow.
Plan
Hire and buy at the right time
A forecast shows when demand will rise, so you hire, order stock or add capacity before you are overwhelmed.
Funding
Win over lenders
Banks and investors expect a realistic forecast in your business plan, with clear assumptions.
A forecast also makes your goals measurable. If you set quarterly OKRs, the sales forecast tells you whether the target is a stretch or simply business as usual.
5 sales forecasting methods
| Method | How it works | Best for |
|---|---|---|
| Historical (past sales) | Use last year’s sales for the same month, adjusted for growth and known changes | Businesses with at least 12 months of sales data |
| Pipeline | Multiply each open deal by its win probability for its stage | B2B, agencies and consultants with a sales pipeline |
| Lead-driven | Expected leads × conversion rate × average order value | Online businesses that track traffic and conversions |
| Market-based (top-down) | Estimate your share of a defined market | New businesses with no sales history |
| Bottom-up capacity | What your team, stock or hours can realistically deliver | Service businesses limited by time or staff |
Many small businesses combine two methods. For example, an agency might use the pipeline method for the next three months and historical trends for the rest of the year. If you use a pipeline, my guide on how to build a sales pipeline shows how to set stages and win rates.
⚠️ Be careful with top-down forecasts
“We only need 1% of a huge market” is the classic forecasting trap. Market share is earned customer by customer, so always cross-check a top-down estimate with a bottom-up view of leads and conversions.
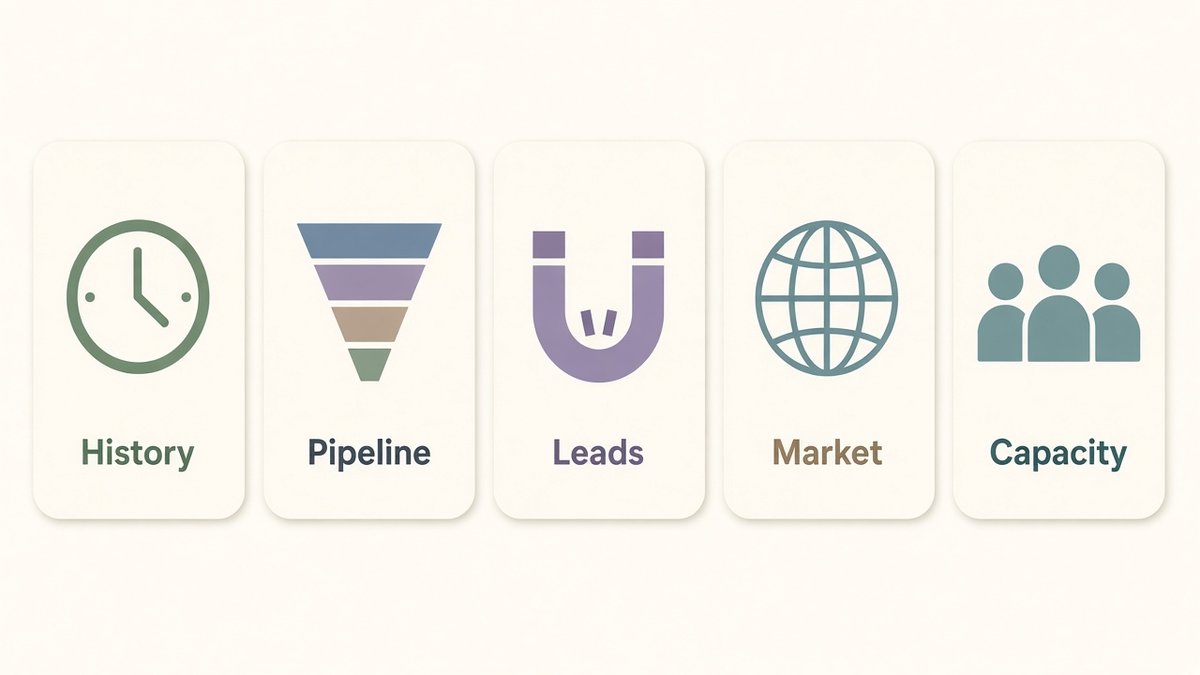
Five sales forecasting methods side by side: historical trend, pipeline, lead-driven, market-based and capacity.
How to create a sales forecast in 7 steps
Choose the period and level of detail
Forecast monthly for 12 months. Split by product or service line so you can see what drives the total.
Gather your data
Export past sales, current pipeline, website traffic, lead numbers and conversion rates from your accounts, CRM and analytics.
Pick your method
Use historical data if you have it, the pipeline method for big-ticket B2B deals and lead-driven forecasting for online sales.
Estimate units or customers per month
Work out how many sales you expect each month, adjusting for seasonality, holidays and planned campaigns.
Multiply by average price
Use price excluding VAT or sales tax and include planned price changes. Add recurring revenue from existing customers separately.
Create best and worst cases
Adjust key assumptions up and down, for example conversion rate or deal win rate, to show a realistic range.
Write down assumptions and review monthly
List every assumption next to the numbers, then compare forecast with actual sales at the end of each month and update.
💡 Start with what you control
Leads, conversion rate and average order value are the three levers behind most forecasts. If you know them, you can explain and improve every number in your forecast.
Sales forecast example
Here is a simple lead-driven forecast for a small online course business for one quarter. All figures are illustrations to show the method, not benchmarks.
| Month | Expected leads | Conversion rate | New sales | Average price | Forecast revenue |
|---|---|---|---|---|---|
| January | 1,000 | 2% | 20 | $200 | $4,000 |
| February | 1,200 | 2% | 24 | $200 | $4,800 |
| March (launch campaign) | 2,000 | 2.5% | 50 | $200 | $10,000 |
The quarter totals $18,800. A worst case might assume a 1.5% conversion rate and 20% fewer leads in March, while a best case might assume the launch converts at 3%. Showing all three gives a far more useful picture than a single number.
For a B2B service, the pipeline method works the same way: a $10,000 proposal at 50% probability contributes $5,000 to the forecast, and a $6,000 early-stage lead at 10% contributes $600.
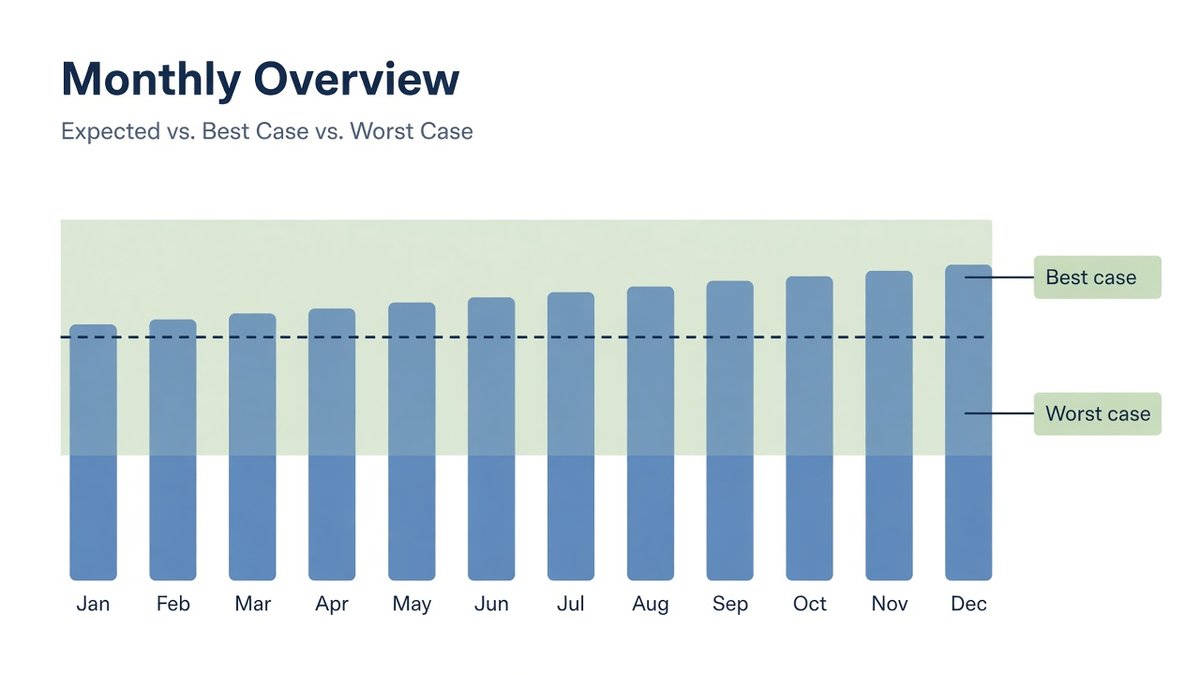
A sales forecast example shown as monthly bars with a best case and worst case range around the expected line.
Forecasting recurring and seasonal sales
Two patterns trip up many sales forecasts: recurring revenue and seasonality. Both are easy to handle once you separate them from one-off sales.
Recurring revenue. If you sell subscriptions, retainers or memberships, forecast them on their own line. Start with current monthly recurring revenue, subtract expected cancellations (your churn rate from recent months) and add expected new subscribers. For example, 200 members at $30 a month with 4% monthly churn lose about 8 members a month unless new sign-ups replace them.
Seasonality. Compare each month with the average month over the last one or two years. If December sales are usually 1.5 times your average month and August is 0.7 times, apply those seasonal factors to your baseline. Retailers often see peaks around Black Friday and the holidays, B2B firms often slow down in August in Europe and in late December, and tax or wedding businesses have their own calendars.
💡 Plan campaigns into the forecast
Product launches, email promotions and price changes are known in advance. Add them to the months they happen, with their own assumption, instead of hoping they show up in the average.
Common forecasting mistakes
- Confusing targets with forecasts: a forecast built backwards from a goal is not evidence-based.
- Ignoring seasonality: December, summer holidays and Black Friday change demand sharply in many sectors.
- One single number: without a range, you cannot plan for a bad month.
- Forgetting churn and refunds: recurring revenue falls when customers leave; read my customer retention strategies to reduce it.
- Never updating it: a forecast written in January and never revisited is out of date by March.
- Including VAT or sales tax: forecast net revenue, because tax collected is not yours.
How to track forecast accuracy
At the end of each month, compare actual sales with the forecast. Forecast accuracy is commonly measured as variance: (actual − forecast) ÷ forecast × 100. If you forecast $10,000 and sell $9,000, your variance is −10%.
| What you see | What it usually means | What to do |
|---|---|---|
| Consistently under forecast | Assumptions too optimistic | Lower conversion rates or win probabilities |
| Consistently over forecast | Assumptions too cautious | Raise estimates and plan more capacity |
| Large swings both ways | Not enough data or unclear drivers | Forecast by product line and track leads weekly |
Add forecast accuracy to your list of small business KPIs. It also helps you judge marketing spend: if you know your customer acquisition cost, you can forecast how many customers extra budget should bring.
Sales forecast template
Copy this sales forecast template into a spreadsheet, with one row per product line and one column per month.
Monthly sales forecast template
Month: [month and year]
Product or service line: [name]
Expected units or new customers: [number] (based on: [history / pipeline / leads])
Average price, excluding VAT or sales tax: [$ / €]
Forecast revenue = Units × Average price: [result]
Recurring revenue from existing customers: [$ / €]
Total forecast: [sum]
Best case / worst case: [result] / [result]
Key assumptions: [conversion rate, seasonality, price changes, launches]
Actual result and variance: [fill in at month end]
Keep the assumptions box filled in. When a forecast misses, the assumptions show you exactly what to fix next time.
Frequently Asked Questions
What is the simplest way to create a sales forecast?
Take last year’s sales for each month, adjust them for expected growth and known changes such as price increases or new products, then compare with actual sales every month.
How far ahead should a small business forecast sales?
Twelve months, broken down by month, is the most common. Many businesses also keep a rough three-year view for funding and planning.
How do I forecast sales for a new business with no history?
Use a lead-driven or bottom-up method: estimate traffic or outreach, a realistic conversion rate and your average price. Cross-check against competitors and market size, and keep the forecast conservative.
What is the difference between a sales forecast and a sales target?
A forecast is your realistic expectation based on evidence. A target is the result you want to achieve. Plan spending against the forecast and use the target to motivate the team.
How accurate should a sales forecast be?
Accuracy improves with data and practice. Aim to narrow the gap between forecast and actual each month, and use best and worst case ranges rather than expecting a perfect single figure.
Which tools can I use for sales forecasting?
A spreadsheet is enough to start. As you grow, a CRM with deal stages and win probabilities makes pipeline forecasting faster and more reliable.
Now you know how to create a sales forecast, which method fits your business and how to keep it accurate. Build your first 12-month forecast with the template above, write down your assumptions and review it every month: within a few months you will plan with numbers you can trust.