Disclosure: This post contains affiliate links, including Amazon links. As an Amazon Associate I earn from qualifying purchases, at no extra cost to you.
Tracking the right small business KPIs is one of the simplest ways to grow with confidence. KPIs, or key performance indicators, are the handful of numbers that tell you whether your business is healthy, where money is leaking and what to fix next. Without them, you are running on gut feeling. This guide explains 12 essential small business KPIs, how to calculate each one with simple examples, and how to build a one-page dashboard you will actually use.
✔ Key takeaways
- KPIs are the handful of numbers linked to important goals that tell you whether your business is on track.
- Most small businesses do best with 8 to 12 KPIs grouped into money, customers and operations.
- Profit is not the same as cash, so track operating cash flow and cash runway as well as margins.
- Compare customer lifetime value with acquisition cost, and track conversion at every step of your sales process.
- Keep a one-page dashboard with targets, a traffic-light system and an owner for each KPI, and act when a number turns red.
📋 In this guide
- What Is a KPI, and Why Does It Matter?
- Money KPIs
- Customer KPIs
- Operations KPIs
- KPI Formulas at a Glance
- Which KPIs Matter Most for Your Business Type?
- How to Build a Simple Small Business KPI Dashboard
- Leading vs Lagging Indicators
- Notes for US, UK and EU Businesses
- Common KPI Mistakes to Avoid
- Frequently Asked Questions
What Is a KPI, and Why Does It Matter?
A KPI is a measurable value linked to an important goal. Revenue is a number; revenue growth against last year’s target is a KPI. The difference is that a KPI tells you whether you are on track.
Good KPIs help you:
- Spot problems early, before they turn into a cash crisis.
- Make decisions based on evidence rather than opinion.
- Keep your team focused on what really matters.
- Show lenders, investors or buyers that the business is well managed.
You do not need dozens of metrics. Most small businesses do best with 8 to 12 KPIs reviewed regularly. The 12 below are grouped into money, customers and operations. Pick the ones that fit your business model.
💡 Fewer is better
You do not need dozens of metrics. Pick the 8 to 12 that fit your business model and review them regularly.
Money KPIs
1. Revenue growth rate
This shows how fast your sales are growing. Formula: (this period’s revenue – last period’s revenue) / last period’s revenue x 100. If you made $40,000 last quarter and $46,000 this quarter, your growth rate is 15%. Compare the same months year on year if your business is seasonal.
2. Gross profit margin
Gross margin tells you how much of each sale is left after paying the direct costs of delivering it, such as materials, stock or subcontractors. Formula: (revenue – cost of goods sold) / revenue x 100. Revenue of EUR 100,000 with direct costs of EUR 60,000 gives a 40% gross margin. A falling margin usually means rising supplier costs or too much discounting. Reviewing your prices and supplier contracts once or twice a year helps you fix it.
3. Net profit margin
Net margin is what remains after every cost, including rent, salaries, software, interest and tax. Formula: net profit / revenue x 100. A business can grow its sales and still lose money, so this number keeps you honest.
4. Operating cash flow
Profit is not the same as cash. Operating cash flow measures the cash your day-to-day trading actually brings in or uses up in a month or quarter. Your accounting software can usually produce a cash flow statement. If this number is regularly negative, act quickly. These ideas on how to improve cash flow are a practical starting point.
5. Cash runway
Runway tells you how many months you could keep going if no new money came in. Formula: cash in the bank / average monthly net cash outflow. With $60,000 in the bank and a net burn of $10,000 a month, you have six months of runway. Many advisers suggest keeping at least three to six months of essential costs in reserve.
Customer KPIs
6. Customer acquisition cost (CAC)
CAC shows how much you spend to win each new customer. Formula: total sales and marketing spend in a period / number of new customers in that period. If you spent $5,000 and won 50 customers, your CAC is $100. Track it by channel so you know which ads, events or partnerships are worth the money.
7. Customer lifetime value (CLV)
CLV estimates the gross profit a typical customer brings over the whole relationship. A simple version: average order value x purchases per year x average years as a customer x gross margin. A customer who spends EUR 80 four times a year for three years at a 50% margin is worth about EUR 480 in gross profit. As a rule of thumb, many businesses aim for CLV to be at least three times CAC.
8. Customer retention rate
Retention measures how many customers stay with you. Formula: (customers at end of period – new customers gained) / customers at start of period x 100. Start with 200 customers, gain 30 and end with 210, and your retention rate is 90%. The flip side is churn, the share you lose. Keeping customers is usually far cheaper than finding new ones, which is why our customer retention strategies guide is worth a read.
9. Conversion rate
Conversion rate shows the share of visitors, leads or quotes that turn into paying customers. Formula: conversions / total visitors or leads x 100. If 2,000 people visit your online shop and 50 buy, your conversion rate is 2.5%. Track it at each step, from website visit to enquiry to sale, to see where people drop out.
10. Average order value (AOV)
AOV is the average amount a customer spends per order. Formula: total revenue / number of orders. Raising AOV through bundles, add-ons or minimum order thresholds for free delivery is often easier than finding more customers.
Operations KPIs
11. Days sales outstanding (DSO)
DSO tells you how long, on average, customers take to pay you. Formula: accounts receivable / total credit sales x number of days in the period. If customers owe you $30,000 and you made $90,000 of credit sales in a 90-day quarter, your DSO is 30 days. A rising DSO is an early warning sign for cash problems, so chase invoices promptly and consider shorter payment terms or deposits.
12. Revenue per employee
This shows how productive your team is overall. Formula: annual revenue / number of full-time-equivalent employees. A business with $900,000 in revenue and six staff makes $150,000 per employee. Compare it over time rather than with other industries, and watch whether new hires actually increase it.
KPI Formulas at a Glance
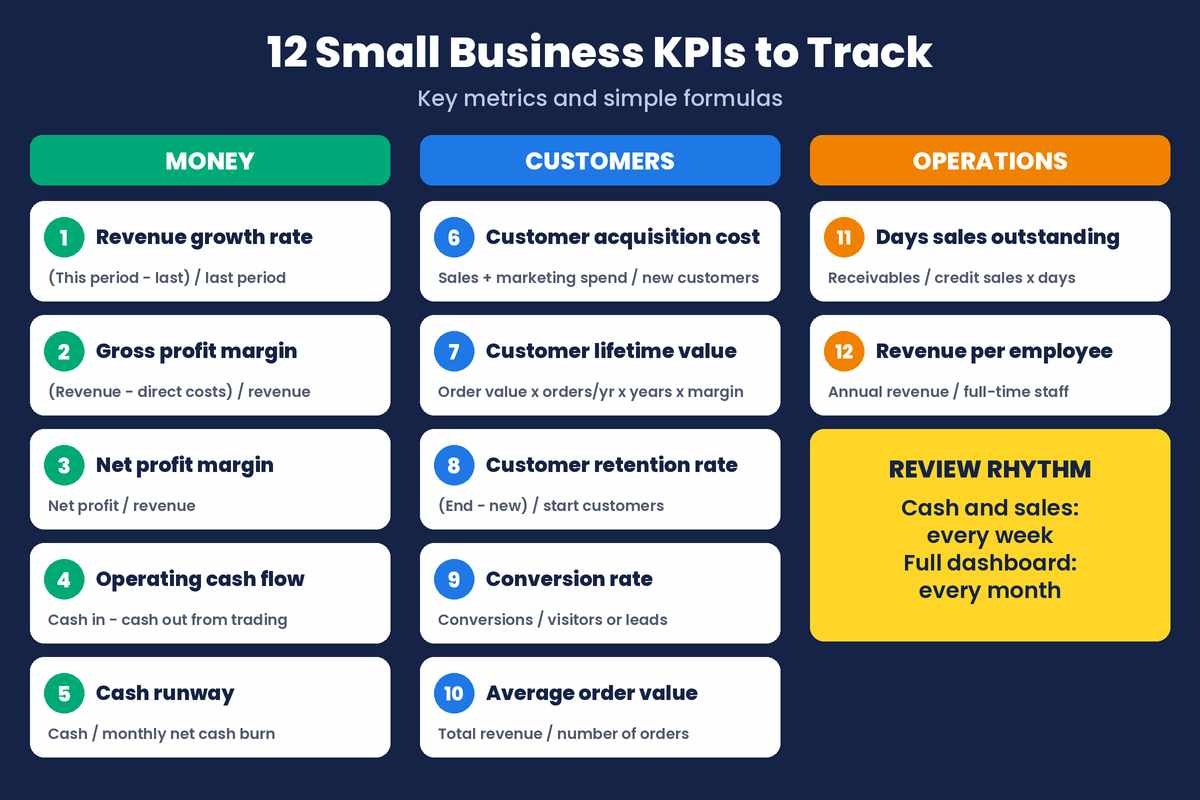
Save this table as a quick reference. It collects the formulas from the sections above in one place, so you can copy them straight into your dashboard.
| KPI | Formula | What it tells you |
|---|---|---|
| Revenue growth rate | (This period’s revenue – last period’s) / last period’s x 100 | How fast sales are growing |
| Gross profit margin | (Revenue – cost of goods sold) / revenue x 100 | What is left after direct costs |
| Net profit margin | Net profit / revenue x 100 | What is left after every cost |
| Cash runway | Cash in the bank / average monthly net cash outflow | Months you could keep going |
| Customer acquisition cost | Sales and marketing spend / new customers | Cost to win each customer |
| Customer lifetime value | AOV x purchases per year x years as a customer x gross margin | Gross profit per customer over time |
| Customer retention rate | (Customers at end – new customers) / customers at start x 100 | How many customers stay |
| Conversion rate | Conversions / visitors or leads x 100 | How well you turn interest into sales |
| Average order value | Total revenue / number of orders | Average spend per order |
| Days sales outstanding | Accounts receivable / credit sales x days in period | How fast customers pay |
| Revenue per employee | Annual revenue / full-time-equivalent staff | Overall team productivity |
Which KPIs Matter Most for Your Business Type?
Every business should watch cash and profit, but the rest of your list depends on how you make money. Use these starting points and adjust them to your goals.
- Service business or agency: net profit margin, DSO, customer retention rate and revenue per employee. Late payments and lost clients hurt service firms most.
- Online shop or e-commerce: gross profit margin, conversion rate, average order value and CAC by channel. Small changes in these numbers add up quickly with volume.
- Subscription or membership: retention rate, CLV, CAC and cash runway. Keeping members is the engine of growth.
- Local shop or restaurant: gross profit margin, operating cash flow, average order value and repeat customer numbers.
How to Build a Simple Small Business KPI Dashboard
- Choose 8 to 12 KPIs. Start with the ones linked to your biggest goals this year, such as growth, profit or cash.
- Set a target for each. Base targets on your own history and your business plan, not on someone else’s averages.
- Use one sheet. A simple spreadsheet with a column for each month works well. Many accounting and CRM tools can export the numbers for you.
- Use a traffic-light system. Green for on target, amber for slightly off, red for action needed.
- Review on a schedule. Look at cash and sales weekly, and the full dashboard monthly.
- Assign an owner. Every KPI should have a person responsible for improving it.
Leading vs Lagging Indicators
Most of the KPIs above are lagging indicators: they tell you what has already happened. It also helps to track a few leading indicators, which predict future results. Examples include the number of sales calls booked, website enquiries, proposals sent or trial sign-ups. If leading indicators drop this month, revenue is likely to drop next month, which gives you time to react.
📌 Watch the early signals
If leading indicators such as calls booked or enquiries drop this month, revenue is likely to drop next month. That gives you time to act.
Notes for US, UK and EU Businesses
The formulas work everywhere, but a few local details can distort your numbers if you are not careful:
- Leave VAT and sales tax out of revenue. If you are VAT-registered in the UK or EU, or collect sales tax in the US, that money is not yours. Use net revenue in your margin and growth calculations.
- Use one currency. If you sell in dollars, pounds and euros, convert everything to one reporting currency, and note that exchange-rate swings can move your numbers.
- Match your financial year. Compare periods that line up with your accounting year, so your dashboard matches your accounts and tax returns.
- Follow data protection rules. Customer KPIs often rely on personal data. Under the UK GDPR and EU GDPR, collect only what you need and keep it secure; in the US, check which state privacy laws apply to you.
Common KPI Mistakes to Avoid
- Tracking vanity metrics. Social media followers and page views feel good but rarely pay the bills on their own.
- Measuring too much. Fifty metrics means nobody looks at any of them.
- Ignoring context. Seasonal swings, one-off orders and price changes can distort the numbers.
- Collecting data you do not need. If you track customer behaviour, follow data protection rules such as GDPR in the EU and UK: collect only what you need, be clear about why, and keep it secure.
- Never acting on the data. A KPI is only useful if it leads to a decision.
Want to go deeper? Measure What Matters by John Doerr (UK) explains how to turn goals into measurable key results, and Traction by Gino Wickman (UK) shows how small teams use a simple weekly scorecard to stay on track.
Frequently Asked Questions
How many KPIs should a small business track?
Most small businesses do best with 8 to 12 KPIs. That is enough to cover money, customers and operations without creating a dashboard nobody reads.
How often should I review my KPIs?
Look at cash and sales weekly, and review the full dashboard monthly. Use the same periods each time so you can compare trends.
What is the difference between a KPI and a metric?
A metric is any number you can measure. A KPI is a metric linked to an important goal, usually with a target, so it tells you whether you are on track.
What is a good CLV to CAC ratio?
As a rule of thumb, many businesses aim for customer lifetime value to be at least three times customer acquisition cost. Track both by channel to see where your marketing money works best.
Final Thoughts
You do not need complex software or a finance team to manage by numbers. Pick a short list of small business KPIs, set realistic targets, review them on a regular rhythm and act when something turns red. Within a few months you will understand your business far better, catch problems earlier and make growth decisions with real confidence.
Disclosure: Some links in this post are affiliate links. As an Amazon Associate I earn from qualifying purchases, at no extra cost to you.